Cleaning Up the Mistakes
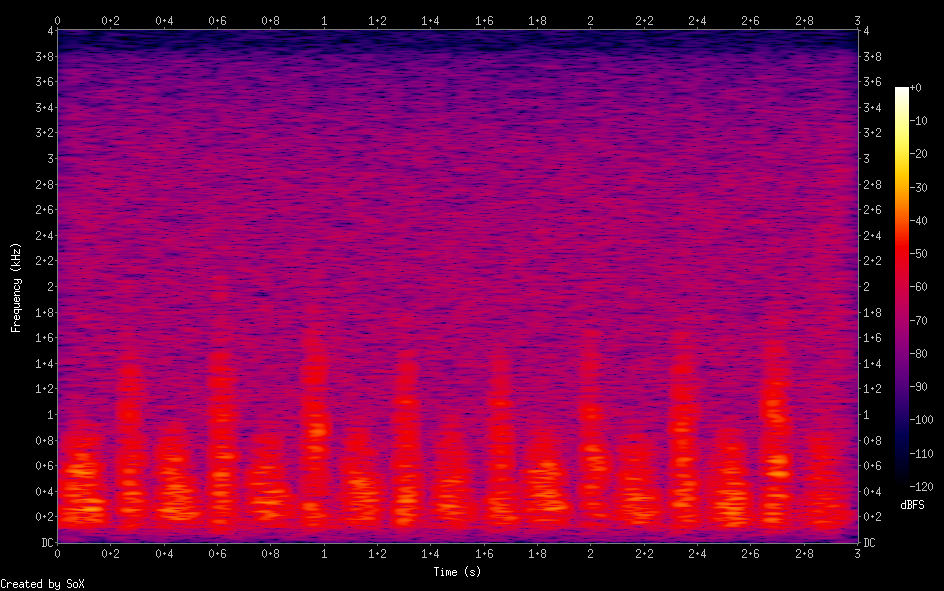
While researching more about signal processing and spectrograms I came across a very helpful video describing an operation known as the inverse Fourier transform or IFT. My previous attempt at mixing sine waves is very similar to the IFT process, but the information contained in the spectrogram image is limited to amplitude and lacks a phase component. I made up for this by assigning randomized phases to each sine wave generator which got me somewhat close to the noise I was trying to generate.
I limited my previous attempt to 1000 sine wave generators because the script performed so poorly and consumed too much RAM. I initially designed the sine generators to utilize wavetables as a performance gain, but through testing I found that it only increased memory usage and that the main contributor to bad performance was repeatedly accessing the image one pixel at a time. I refactored some parts of the code and managed to reduce RAM usage to a minimum and speed up generation by a lot. With the new version of the script I generated an audio file using 100,000 generators in just under an hour. This version was still very slow but orders of magnitude faster than the initial draft. Even with many more generators the audio still did not sound like what I heard elsewhere. I couldn’t tell the difference between 1000 generators and 100,000.
I played around with some more parameters and discovered I made a bad initial assumption. Instead of directly using the brightness of each pixel to set the wave amplitude I was squaring the brightness to increase the contrast of the spectrogram of the audio that was generated. I changed the script to use the brightness to directly control the amplitude of each sine wave and got a little closer to what I was looking for.
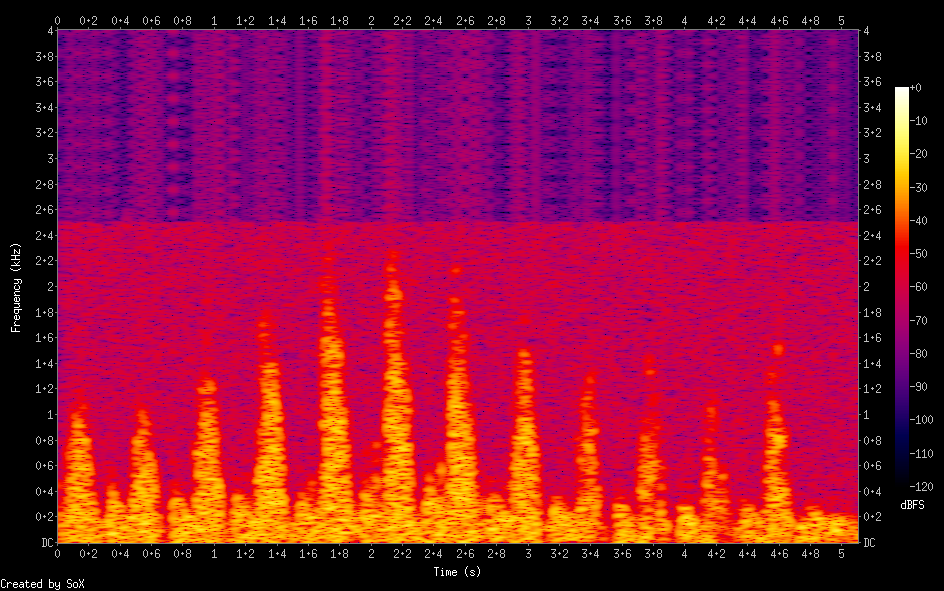
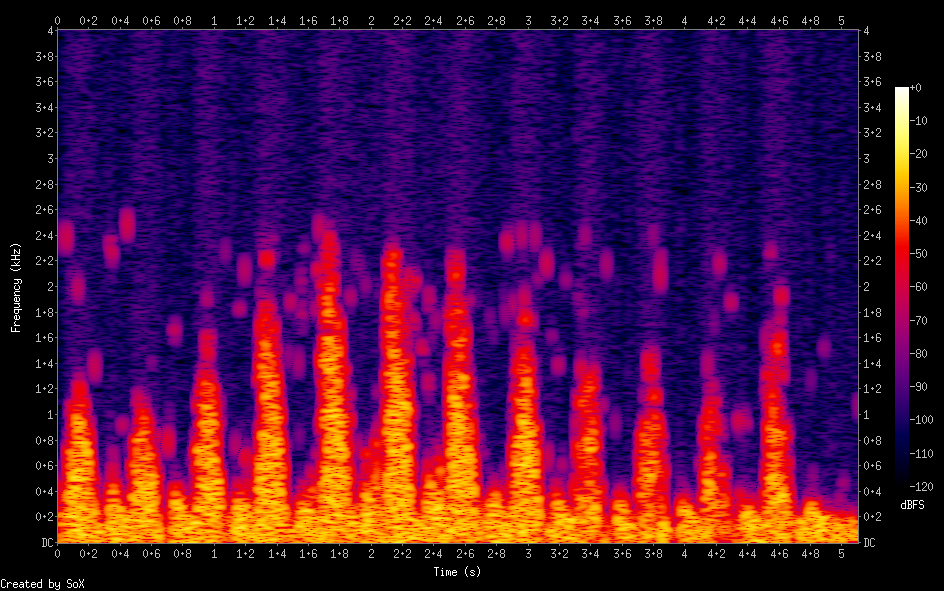
The “tone” of the audio was still off, so I revisited the audio pulled from the YouTube video I was referencing and found another mistake I made. I looked at the spectrogram of the audio in Audacity, but didn’t zoom in to notice the range of 0-4kHz that I was seeing was mostly noise. All the audio that sounded like the heartbeat portion was below 2.5kHz – and it looked to be generated using only the portion of the spectrogram above the mid-line of the graph. Below is a spectrogram created from the example video audio.
I modified the scanned image to remove the portion below the axis line. I also increased the contrast so the background was black and removed some stray image artifacts by hand.
I updated the script so it only generates audio between 0-2.5kHz and uses 2500 generators: 1 per Hz. This produced audio that is much closer to what I am looking for aside from some unwanted noise.
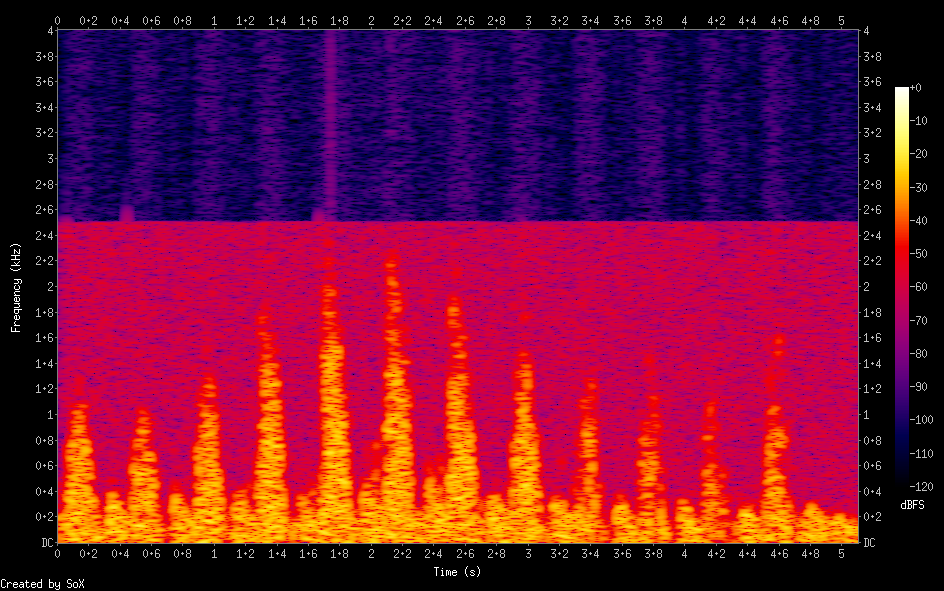
The spectrogram of this audio shows some nasty stuff going on up above 2.5kHz.
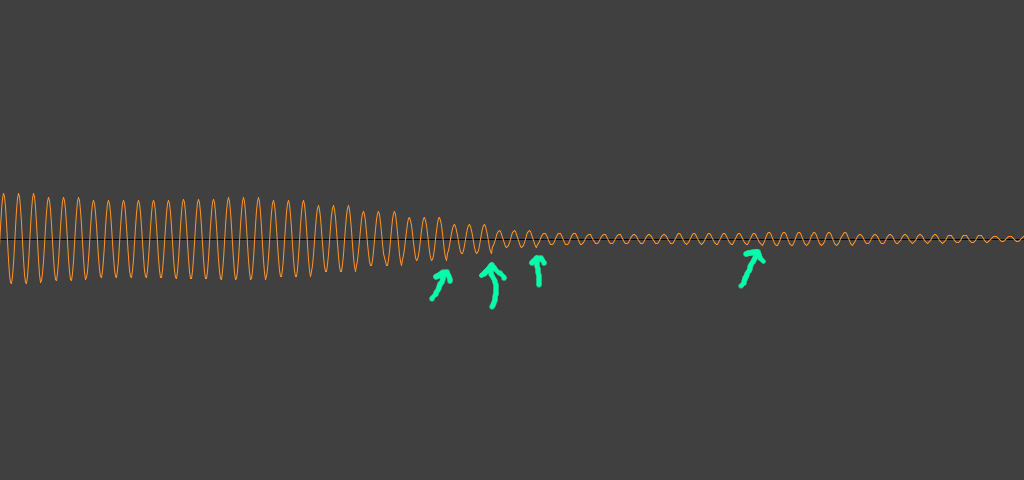
I wasn’t sure what caused this noise so I modified the script to generate a single sine wave and sure enough it was still present on the spectrogram. I took a look at the waveform and the reason became more obvious. The noisy version of the script generates a number of samples of each generator for each input pixel of the image. This causes an abrupt change in amplitude where bright pixels are directly next to dark pixels. The sudden change causes “clicking” artifacts that create some nasty harmonics.
To correct this I added a bit to the script to scale the image horizontally using a bicubic filter before processing it. This smoothed the transition between adjacent bright and dark pixels and reduced the noise. The generated audio file is now free of clicking.
The visible noise above 2.5kHz on the spectrogram was almost entirely eliminated.
The blanket of noise from 0-2.5kHz is intentionally added to mask noise in the
image being converted. Without the noise stray nearly-black pixels will
create odd sounds in the output. Below is audio generated with the background
noise disabled using the script argument --minimum-amplitude 0.
This spectrogram shows the audible noise that has been generated from the almost invisible noise in the source image.
I did one more manual cleanup pass on the image and removed everything outside the visible peaks.
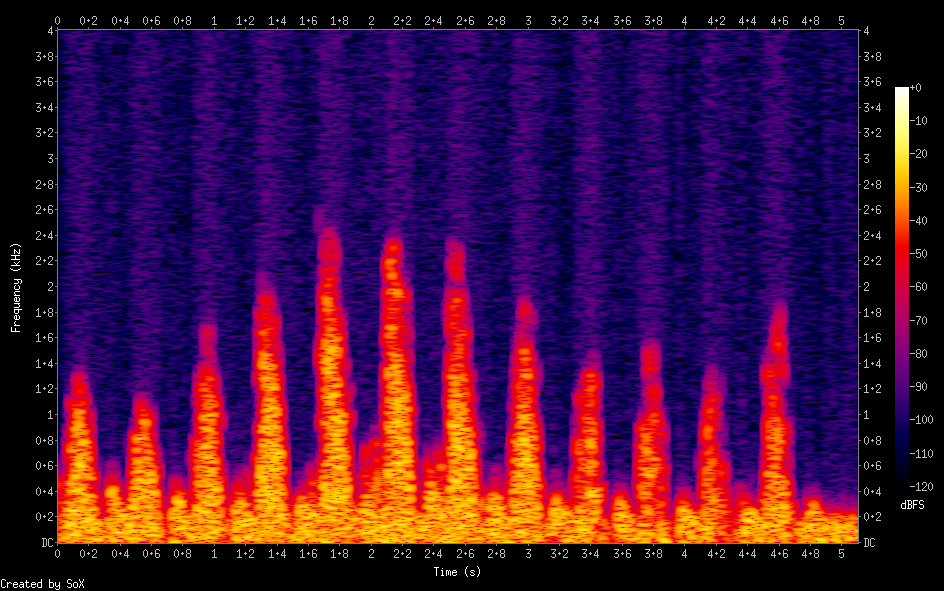
Running it through the script with background noise disabled yielded a nearly perfect output.
The spectrogram also shows the previous artifacts have been completely cleaned from the source image.
I am very pleased with this result. The final invocation of the script that
produced the above audio was
./ultrasynth cleaned-scan.png --samples-per-pixel 45 --minimum-amplitude 0.
I have posted the the script on
GitLab for anyone to use. I am working on cleaning up some minor issues and plan
to publish the updated version soon.


